
The SOC’s MTTR (mean time to respond) dropped 40% this quarter and everyone celebrated. Leadership concluded the security posture was mature enough and cut the security budget. But it turned out analysts were closing alerts faster by investigating less… and several attacks got further along the kill chain before being detected, if they got detected at all. So what went wrong?
The Measures are accurate, but the way we use them is what creates the incentive to distort their meaning.
Note that this article mainly draws on my own experience and on NIST SP 800-55.
1. Measure vs. metric : a number vs a goal
If we take the scenario above as an example, you may ask yourself “How can we objectively know what to do from the MTTR ?”
First, we need to know exactly what is MTTR : it is a duration that has been measured. Measures on their own are just numbers, and it is easy to make them say anything.
Let’s step back a bit and ask “Why did we take these measures in the first place ?”. Finding this right question already gives you part of the answer, since measures only become a metric once they are tied to a goal. NIST makes a clean distinction:
- A measure is a raw quantitative value.
- A metric is a measure used to track progress toward a target and support a decision.
So let me introduce some measures by grouping them by the question they answer :
-
How fast?
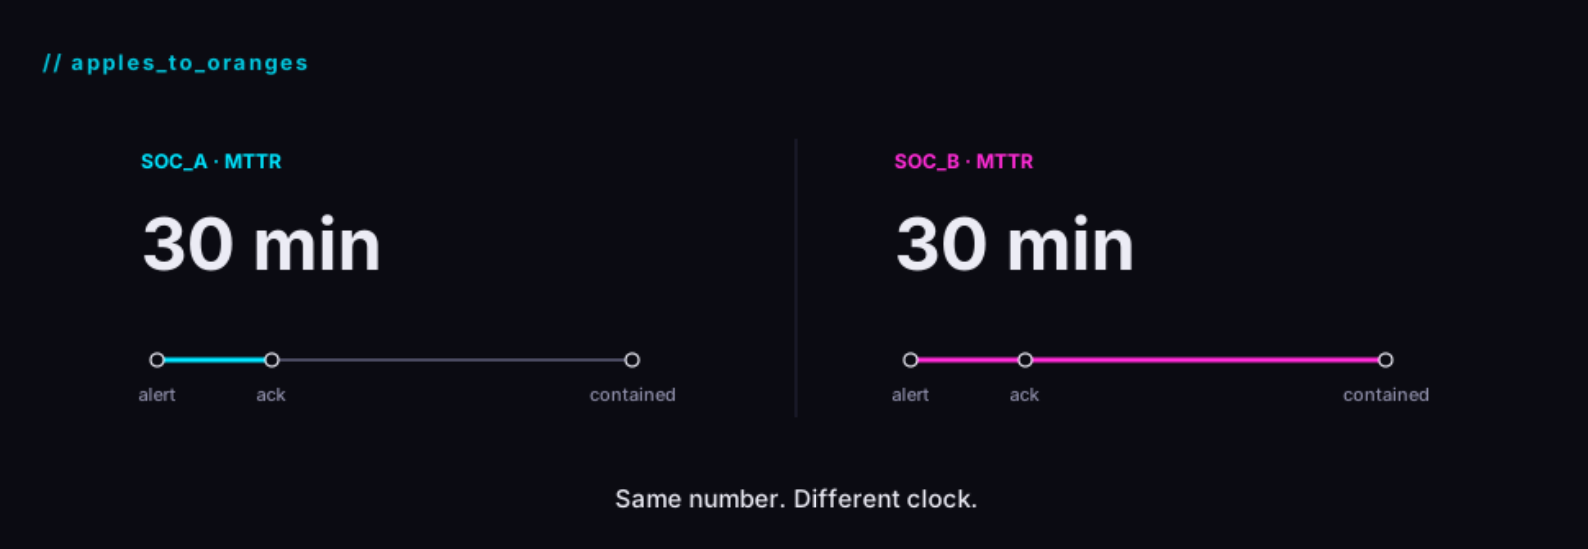
They are expressed as a duration, the famous “Mean Time To… : MTTD (detect), MTTA (acknowledge), MTTI (identify), MTTR (respond). Note that “R” can mean respond, resolve, or recover, which is already a source of confusion. -
How accurate?
They are expressed as the share of alerts in each verdict at the end of triage, hunts/tests or incident response process : dwell time, false positive, false negative (note that it can’t come from triage), true positive malicious, true positive legitimate, alert-to-incident ratio, escalation, “True positive malicious + no impact”, “True positive malicious + accepted risk”, “Awareness campaign trigger”, “Lack of patching/update”. -
How much do we see?
They estimate visibility range : detection coverage (often mapped to MITRE ATT&CK), log source coverage. -
How loaded are we?
They quantify the workload : alert volume, alerts per analyst, automation rate, SLA compliance.
From the question-measure couples we identified, we now know that MTTR is a measure that tells us how long it takes to respond once an alert is raised (assuming we’ve agreed what ‘respond’ means). But we don’t know yet what to do with it…
2. Defining a metric : a measure tied to a goal
The decisions a SOC makes, based on metrics, are often the following ones : budget, staffing, rule tuning, prioritisation, team value. Which decision does the MTTR metric support ?
Let’s go back to our example. In the quarterly review, the CISO’s slide reads: “MTTR down 40%: the SOC has reached operational maturity.” Finance draws the obvious conclusion: if the team is this efficient, it can run on a smaller budget. And if the team is mature, does the training plan for the juniors still need funding? While we’re at it, the night shift seems to be coping fine, so there’s no need to add anyone there either.
Three decisions, one number. And it works just as well in the other direction. Here’s what the same MTTR can be made to say in the same kind of meeting:
- Hiring: “Our mean time to respond went from 3h40 to 5h10 over two quarters, while alert volume grew 30%. The team is saturated. We need two more analysts in next year’s budget.”
- Staffing: “Broken down by hour, MTTR between 10pm and 6am is nearly three times the daytime figure. Attackers don’t keep office hours. We need proper night coverage.”
- Prioritisation: “Phishing cases have the highest MTTR of any category, nine hours on average. That’s where we’re most exposed, so phishing response is our priority for H1.”
- Rule tuning: “Alerts from this rule take more than a day to close on average. Clearly nobody trusts it; it’s noise. Let’s retire it and free up analyst time.”
- Team value: “MTTR is up 20% year over year, despite the new SOAR platform. The tooling is there, so the problem is skills or process. We need a performance review.”
Notice that the hiring and team value arguments start from the same number, MTTR going up, and reach opposite conclusions. One manager asks for more people; another questions the people already there. Same metric, same meeting.
After this exercise, we observe that one number supports five arguments, some of them contradictory. Do you think MTTR is a metric yet ?
3. How metrics can mislead
MTTR fits everywhere because everyone had a goal but nobody said what kind of question it was supposed to answer. They missed a step in the process : goal → question → type of measure that can answer that question
For this, NIST defines 4 types of measures :
- Implementation : is the control in place? Example: % of systems patched.
- Effectiveness : is it actually working?
- Efficiency : how fast does it give feedback, and how fast are issues handled?
- Impact : what does it mean for the business? Costs, fines, value, trust.
Let’s re-read the five arguments for MTTR with that lens :
- Staffing and the night-shift argument hold up. That’s an efficiency question, and MTTR is an efficiency measure.
- Hiring and prioritisation are partly valid. MTTR shows where time goes, but not whether the extra time or money buys anything (impact->cost).
- Rule tuning is a type confusion. Slow closing says nothing about whether a rule catches real threats, which is an effectiveness question.
- Team value is the most abused. A faster MTTR can come from investigating less. It needs an effectiveness counterpart, like reopen rate or missed incidents found later. A slower MTTR can come from harder incidents, more volume, or deeper investigations; a faster one can come from investigating less. Either way, MTTR alone can’t tell you whether the team is good.
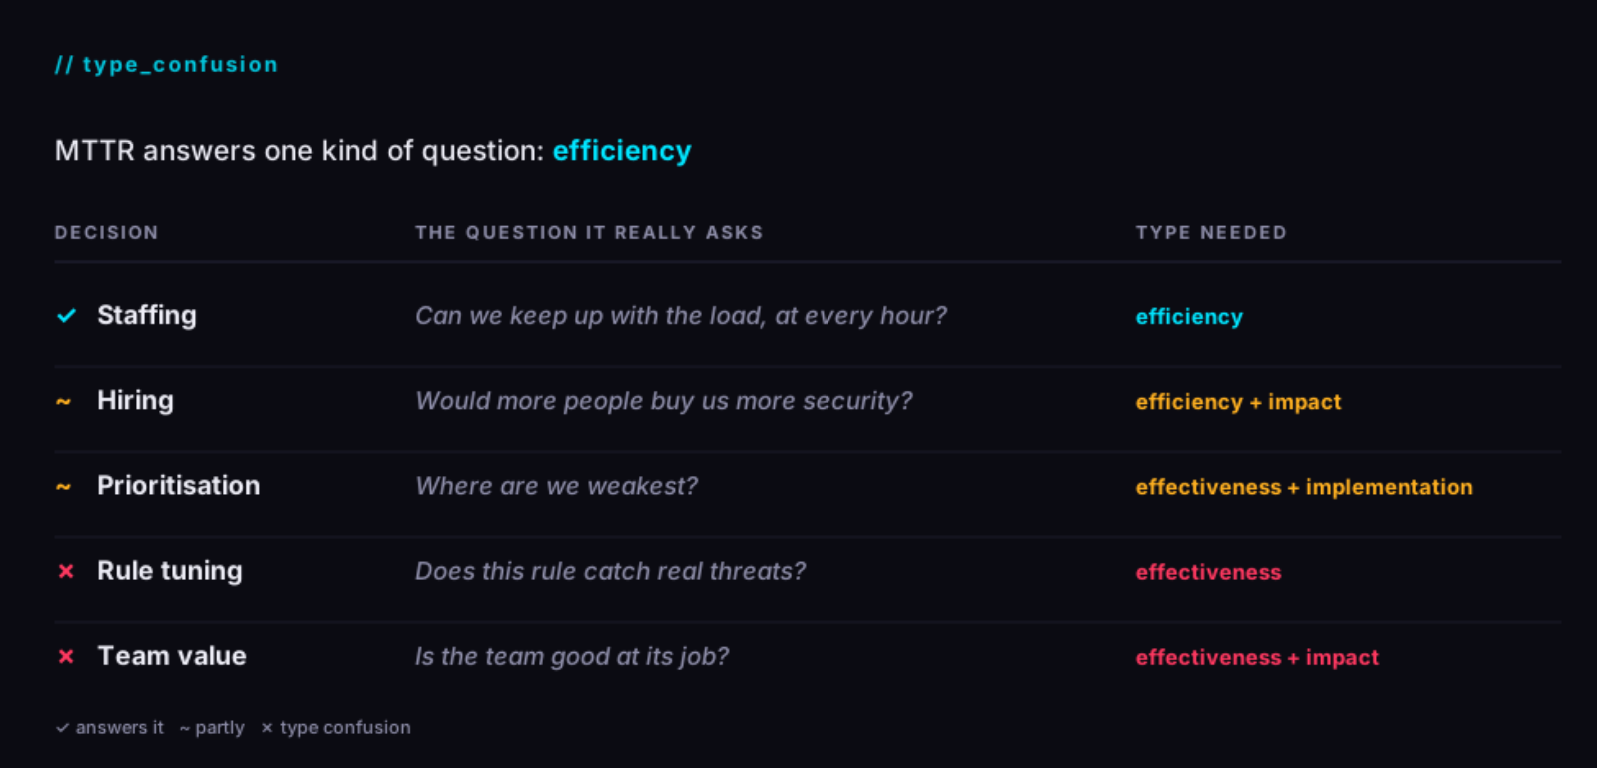
Do you see where we are going ? the organization rewarded a speed number and read it as a quality number, and analysts adapted to that incentive. They confused Efficiency with Effectiveness and Impact.
We can see it through other metrics. Many blue team dashboards show implementation and efficiency metrics, then present them as if they proved effectiveness. “We have 300 detection rules” is implementation, not effectiveness. “We respond in 20 minutes” is efficiency, not effectiveness.
But type confusion (NIST SP 800-55v1, section 3.3) is only one of several biases, devided in two categories.
The number is computed or read wrong
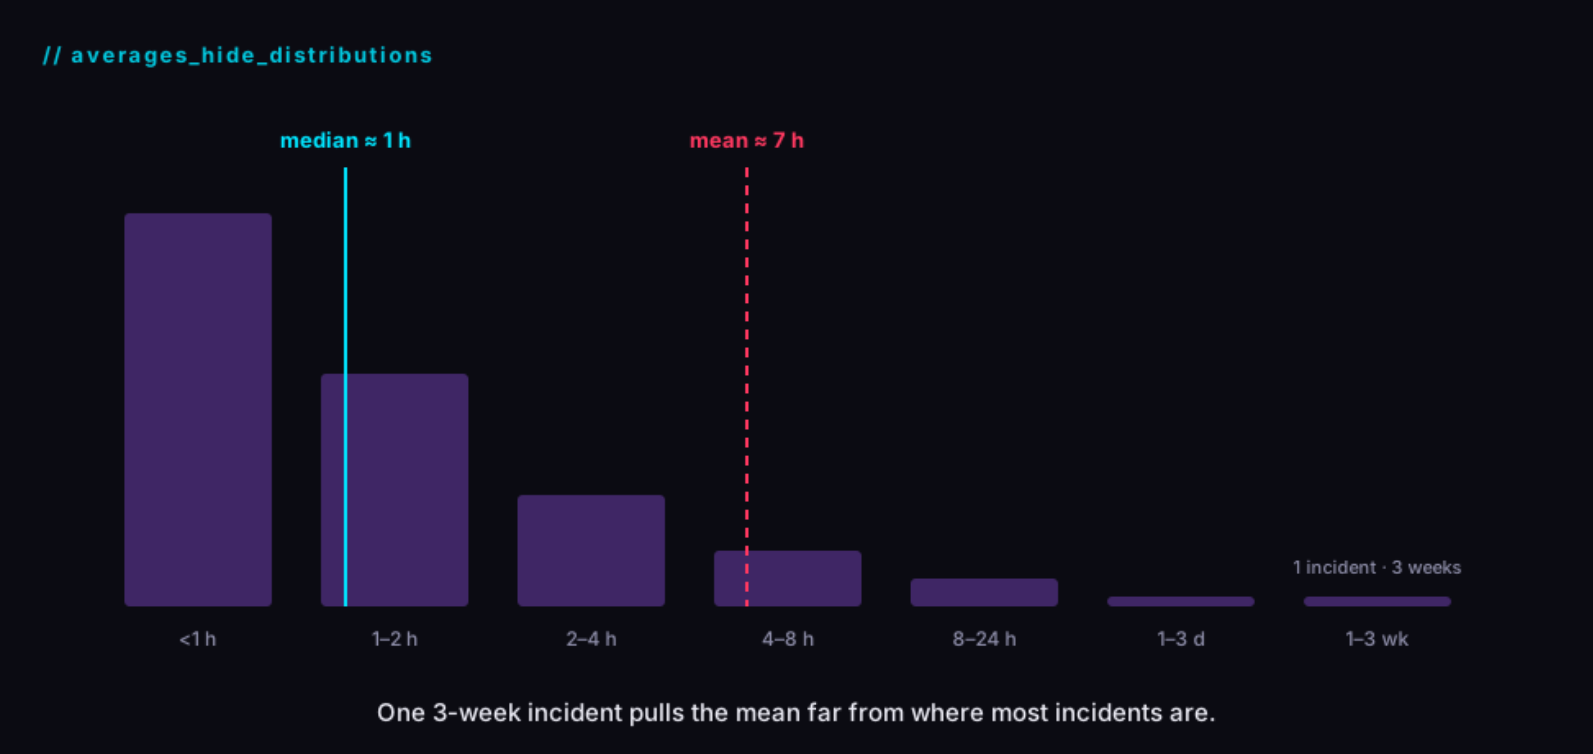
- Averages hide distributions
One 3-week incident wrecks a mean MTTR, and a hundred trivial ones flatter it. Medians and percentiles, or splitting by severity, tell the real story.
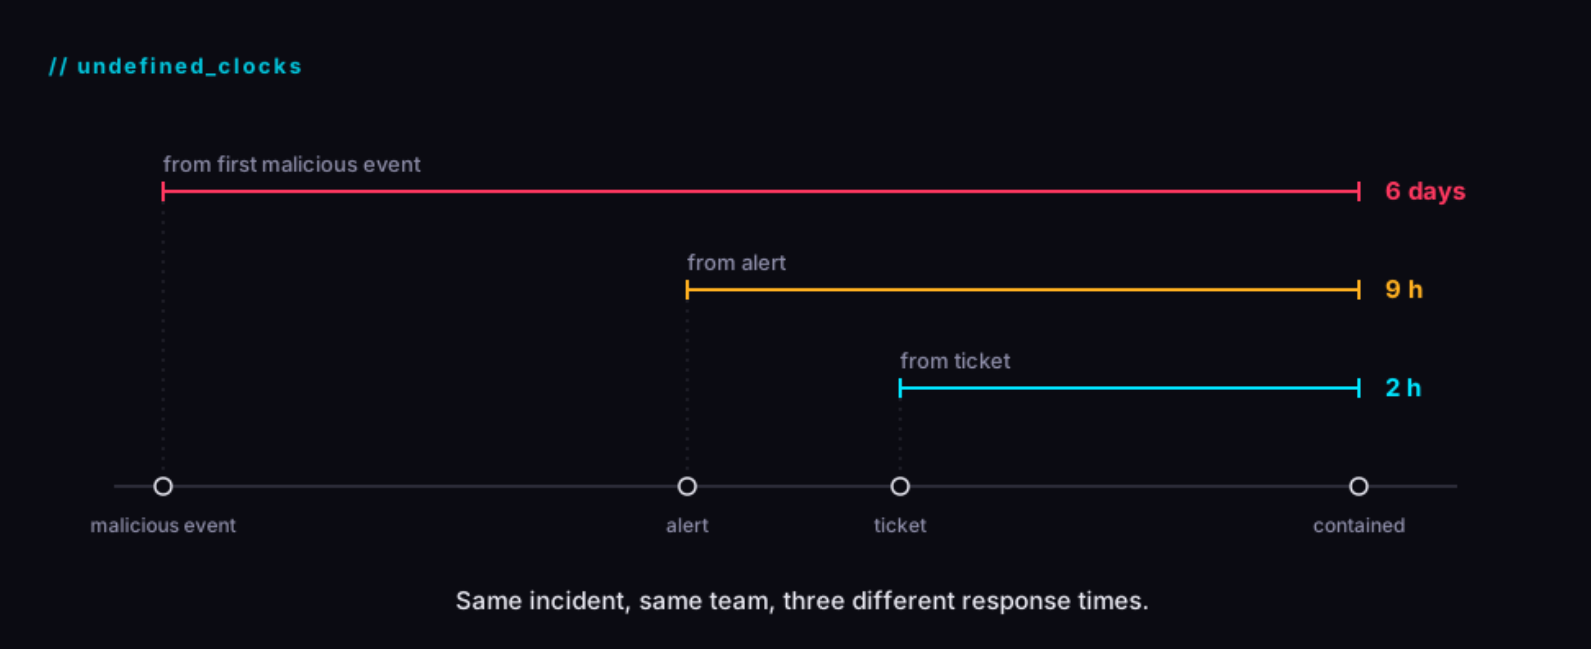
- Undefined clocks
When does detection time start : at the first malicious event, the alert, or the ticket? Changing the start point can “improve” a metric with no operational change.
- Survivorship bias
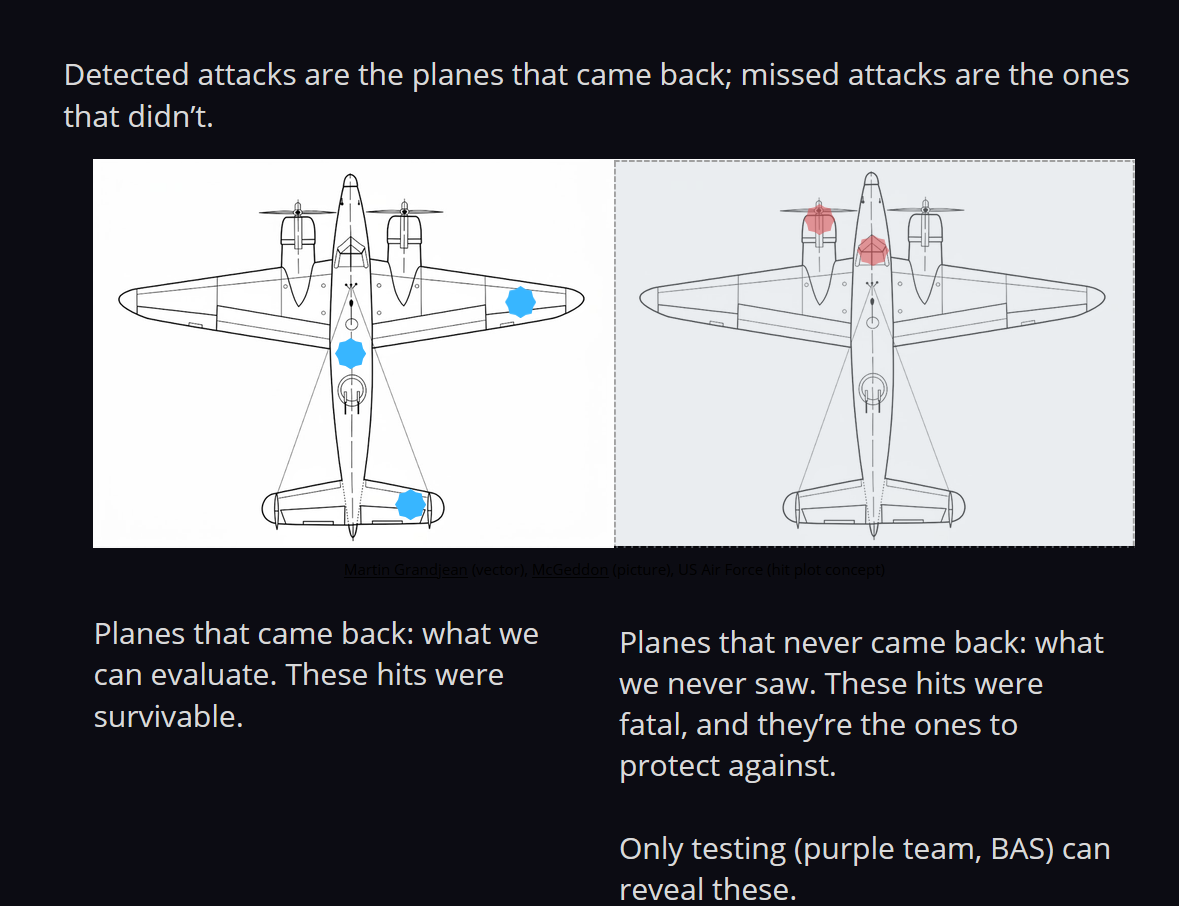
During World War II, the statistician Abraham Wald was asked where to add armour to bombers. Engineers had mapped the bullet holes on planes returning from missions, and the obvious answer was to reinforce the areas that were hit most. Wald pointed out the flaw: they were only looking at the planes that came back. Those holes showed where a bomber could be hit and still return. The planes hit elsewhere, around the engines for example, never made it home, so their damage never appeared in the data. The armour belonged where the returning planes had no holes.
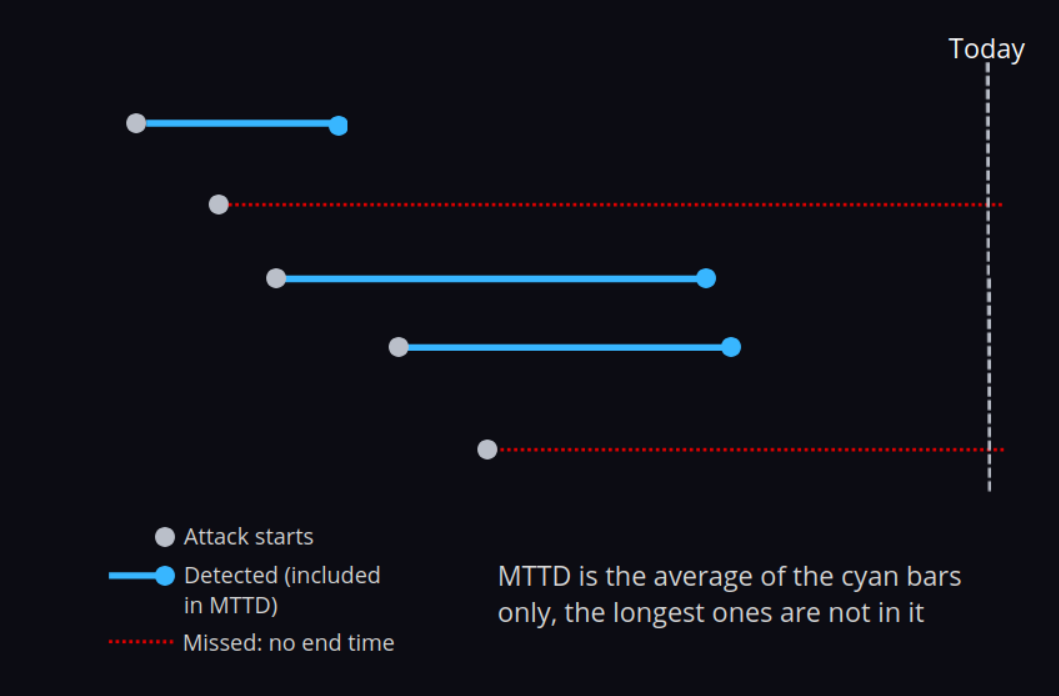
MTTD (mean time to detect) has the same blind spot. It can only be calculated on incidents you detected: these are the planes that came back. The attacks you missed have no detection time, so they don’t make your MTTD worse; they simply aren’t in it. And they are likely the ones that lasted the longest. In other words, a good MTTD tells you how fast you catch the attacks you can see. It says nothing about the ones you can’t.
- Apples-to-oranges comparisons
Comparing teams, quarters, or MSSPs whose metrics are defined differently.
- Quantitative vs. qualitative vs. semi-quantitative
NIST argues that a maturity score like “level 3,” or a 1–5 scale, is not a measurement. Those numbers only have meaning inside the assessment that produced them. Such scores look like data but can’t be averaged or compared like real numbers.
The number is right but used wrong
- Goodhart’s law
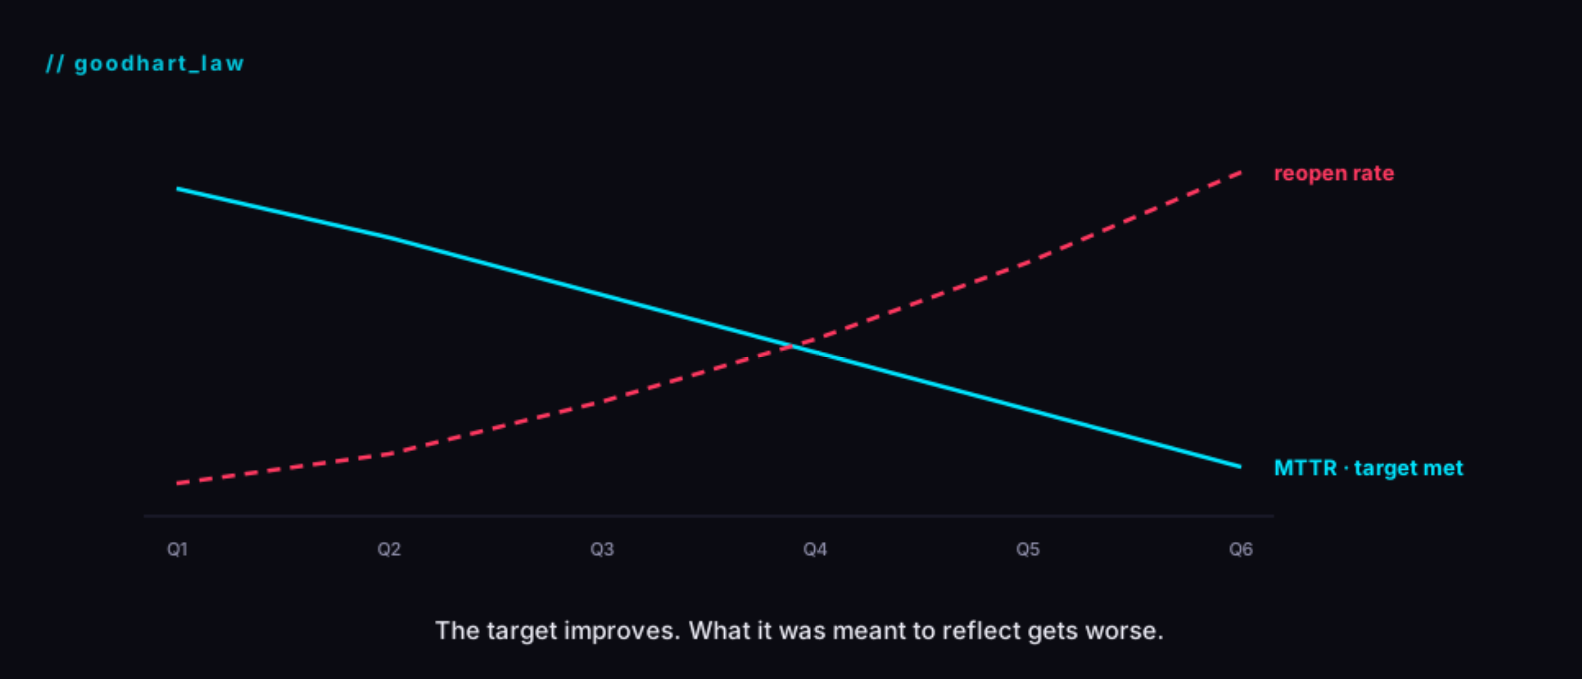
When a measure becomes a target, it stops being a good measure. Examples:- Pushing down the “False Positive” rate leads to disabling noisy rules, or pushing down the “True positive legitimate” alerts for recurrent activities leads to whitelisting recurring activity that occasionally turns out to be a real attack. We miss the effectiveness type.
- An automation % target leads to auto-closing, we miss the effectiveness type again.
- SLA targets get met by acknowledging quickly and then sitting on the alert. It is one efficiency number (time to acknowledge) being gamed at the expense of another (time to respond).
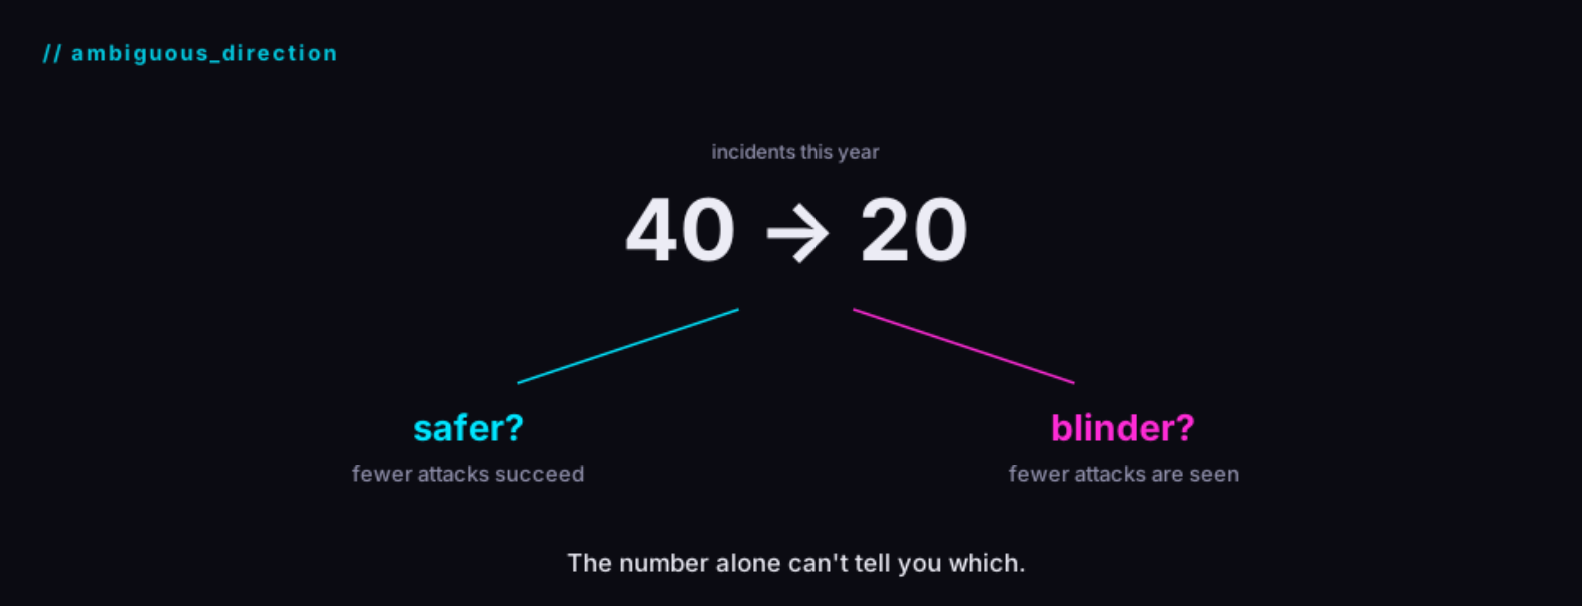
- Ambiguous direction
Fewer incidents could mean better security or worse visibility. This creates the budget paradox : a good team that prevents incidents looks unnecessary, and a team that wants budget has a reason to inflate counts.
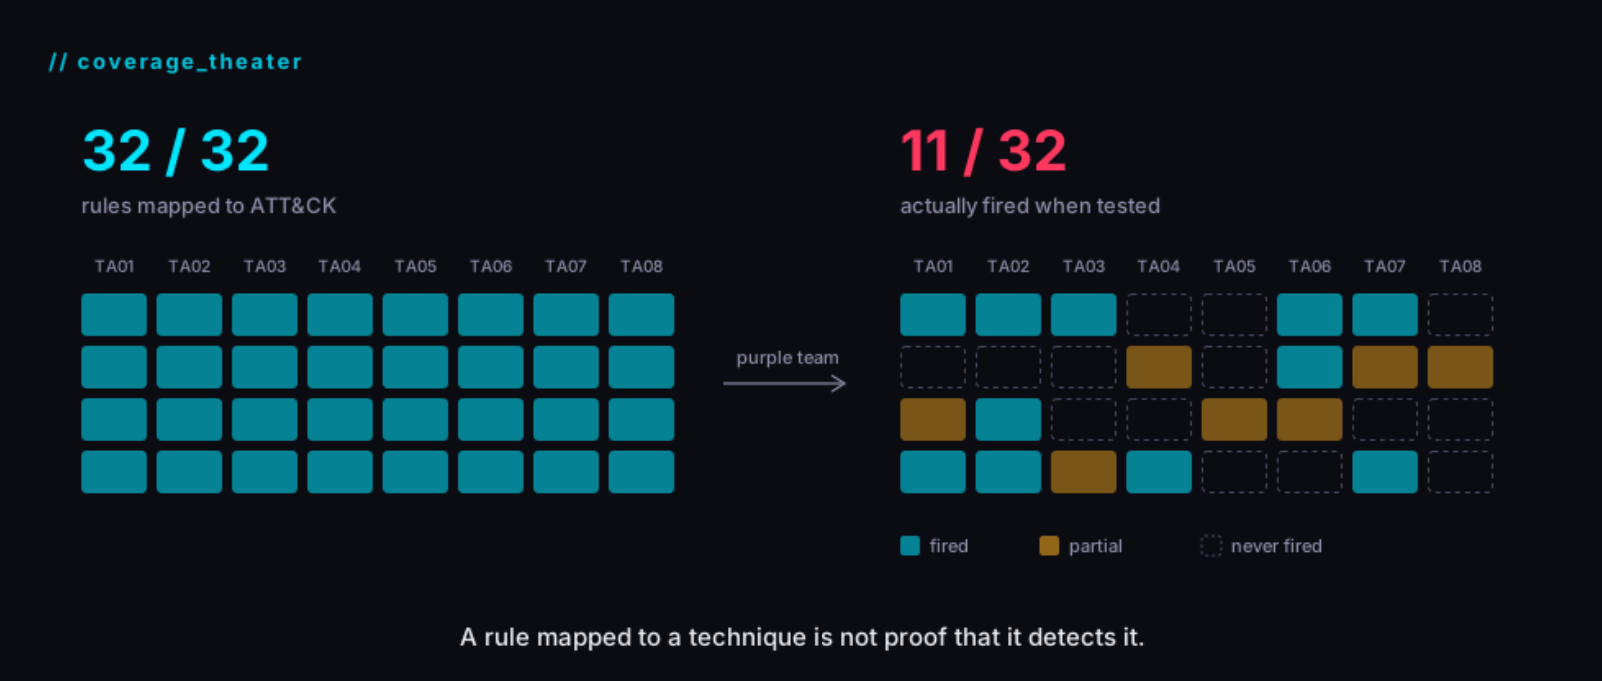
- Coverage theater
“We cover 70% of ATT&CK” usually means a rule is mapped to a technique, not that the rule has ever been shown to fire on a real execution of it.
- Vanity volume
“We processed 50,000 alerts” mostly proves we have a noise problem.
Measures don’t have a fixed type
A measure doesn’t have a type. It gets one.
So far we’ve said “MTTR is an efficiency measure” as if the type were stamped on it. It isn’t. A type describes the question a measure can answer, and that depends on how we build it. Three levers change it:
-
Scope: what we count.
Raw MTTR averages everything, from a mistyped password alert to a ransomware case. Restricted to confirmed malicious incidents and split by severity, it’s still an efficiency measure, but now it measures efficiency where it matters. -
Pairing: what we put next to it.
MTTR next to a reopen rate, or next to the number of incidents later found to be part of a broader compromise, starts answering a different question. Not just “are we fast?” but “are we fast and right?” That’s where effectiveness enters. -
Combination: what we multiply it by.
MTTR multiplied by the cost of an hour of incident (downtime, people mobilized, exposure) becomes a cost, and cost is what leadership actually decides on. That’s impact.
Same raw data, three different questions. The problem in our opening scenario wasn’t MTTR itself. It was a raw, unscoped, unpaired MTTR presented as an answer to an impact question: “Is our security worth what we pay for it?”
Which brings us to the real question: if metrics are built rather than found, how do we build them so they answer the question our goal is actually asking?
4. Building metrics
1. Start from the decision, not the dashboard.
“Less is often more.” NIST explicitly warns against adopting every available data point. It says poorly chosen metrics damage the credibility of the whole report. Its test is to keep a metric only if it directly shows a control’s performance or tracks a material risk.
Define the decision first, then the question it asks, the type of measure that can answer it, and only then the measure itself, always paired with a counter-metric.
Chain example based on the night shift staffing goal :
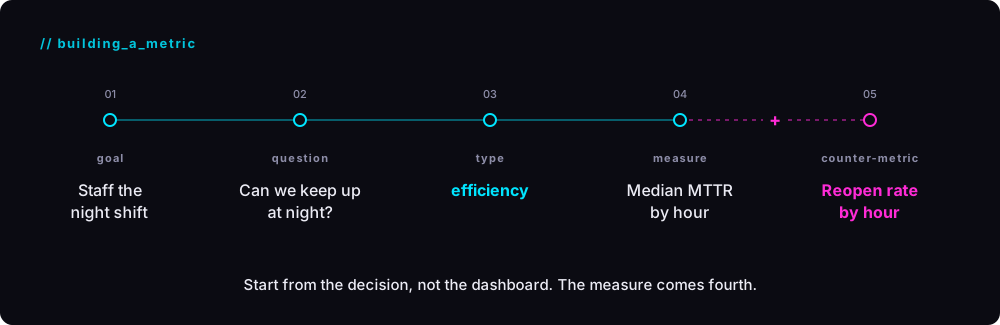
The counter-metric is what keeps a measure honest. Speed goes with quality: MTTR is paired with a reopen rate or a peer-review sample. A false positive rate is paired with detection validation.
2. Metric card
Document each metric in a standard format. NIST’s template (SP 800-55v1, §3.1.1) includes its goal, scope, type, formula, target, data source, collection frequency and responsible parties. I add four fields to it: where the clock starts and stops, its counter-metrics, its known blind spots, and the decisions it should not be used for.
One NIST recommendation is a direct safeguard against manipulation: the person who collects the data should be different from the person who owns it.
Here is an example for MTTR :
# metric_card · MTTR-01
id: MTTR-01
goal: Contain incidents fast enough to limit attacker progress
scope: Confirmed malicious incidents, all severities, 24/7
measure: Median time to respond, in hours
type: efficiency
formula: median(contained_at - alert_created_at)
target: "<= 4 h overall, <= 1 h for P1"
implementation_evidence: Ticket timeline export, sampled monthly
time_reference:
  collected: continuously
  reported: monthly, with a 12-month trend
responsible_parties:
  owner: SOC manager
  collector: Detection engineering   # != owner, avoids conflict of interest
  customer: CISO
data_source: SOAR / ticketing (alert and containment timestamps)
reporting_format: Line chart with acceptable range, split by severity

# --- beyond the NIST SP 800-55 template ---
clock:
  start: alert created
  stop: incident contained
counter_metrics:
  - reopen rate
  - peer review of 5% of closed incidents
blind_spots:
  - attacks that never raised an alert
  - time between first malicious event and alert (see MTTD)
do_not_use_for:
  - judging detection quality
  - comparing with SOCs that use another clock
  - individual analyst performance
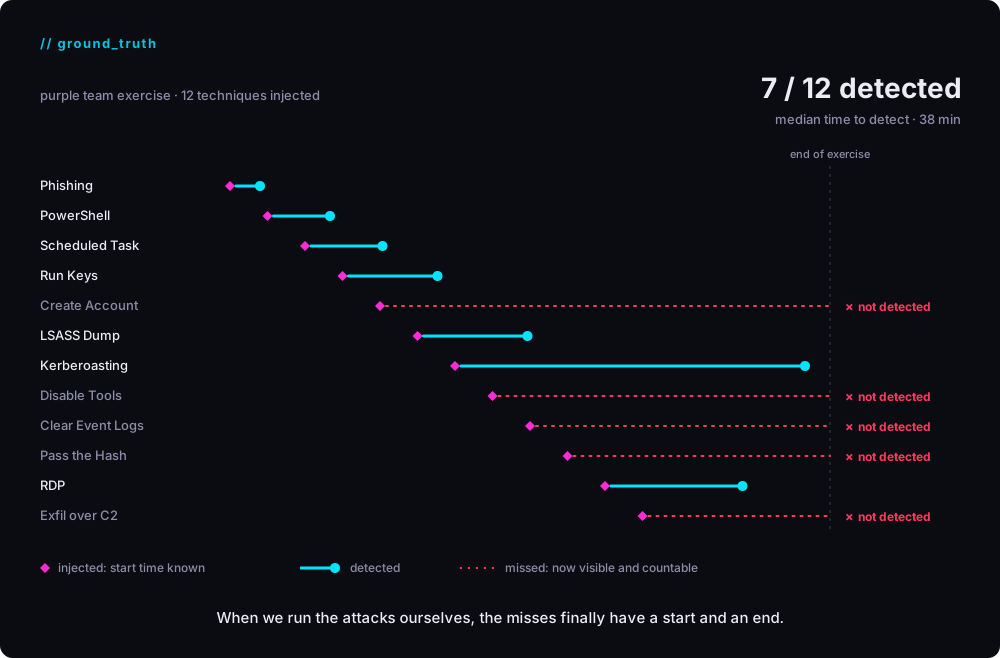
3. Validate against ground truth
Purple teaming, breach-and-attack simulation, or adversary emulation give you a real detection rate on tested techniques. This is the answer to the survivorship problem.
4. Report
Report trends and segments, not single numbers, and add context. A number without its story invites misreading. Separate operational metrics for the team from reporting metrics for leadership, and review both periodically. Retire a metric once people start optimizing for it.
NIST says a measure reported without context can cause unintended consequences or indecision. It suggests every report states the following context elements:
- the risk the measure indicates
- whether that risk fits the risk appetite
- what decision or action is needed
If we follow the previous context rules, it can give the following result:
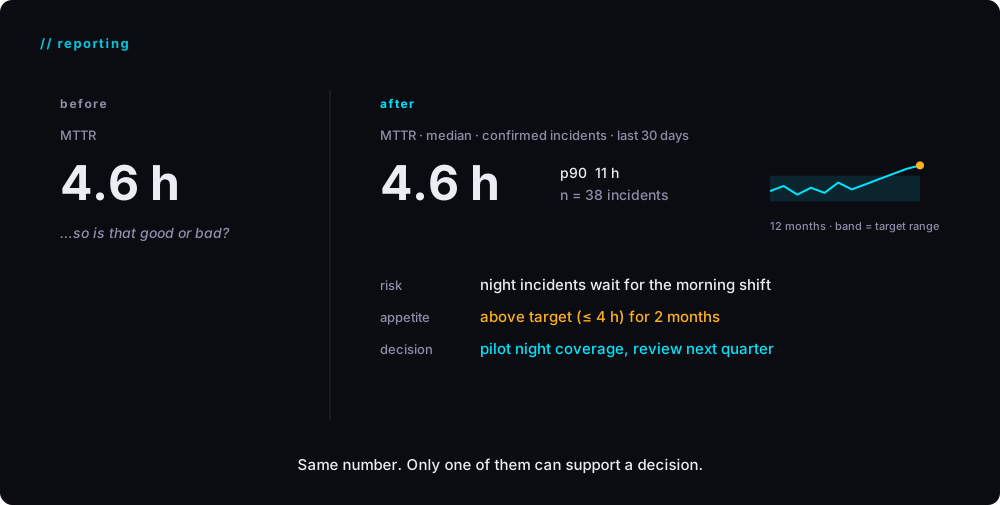
Use ranges and trends, not single values. NIST recommends establishing averages and acceptable ranges over time and keeping metrics consistent so trends become visible. Show medians and percentiles, not just averages, and say how many incidents the number is based on
5. Review and retire
Goodhart’s law means a metric can go bad over time, once people optimize for it. So metrics need periodic review, and gamed ones get retired or redefined.
NIST stresses keeping metrics consistent over time so trends stay readable, and Goodhart pushes you to change them. The practical answer is to change rarely, and when you do, record the change so trend breaks are explained.
Conclusion
We answered all the biases evoked in chapter 3 :
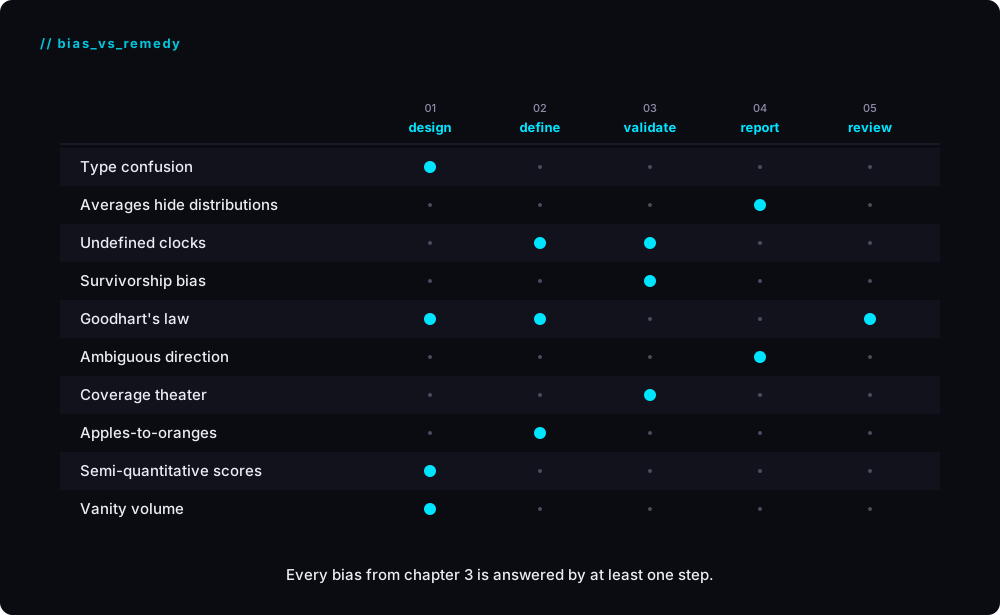
A metric isn’t true or false on its own, and it is not “found” on the dashboard. It is consciously built from an ordered process starting from a goal, the questions it asks, to the type of measure that can answer it, and finally the chosen measure(s) tied to their counter-metric. This way, meaningful and objective decisions can be made by technical people as much as executives.
Sources :
- NIST SP 800-55, describing how to “improve the quality and utility of information to support their technical and high-level decision making” : https://www.nist.gov/cybersecurity-measurement
- Incident Metrics in SRE (2021) uses Monte Carlo simulation and statistical analysis to show that statistics like MTTR are poorly suited for decision making (https://sre.google/resources/practices-and-processes/incident-metrics-in-sre/). It comes from reliability engineering (outages), not security, but the statistical argument transfers.
- The “R” ambiguity in MTTR (https://clickhouse.com/resources/engineering/mttr-mttd)
- The survivor ship bias : classic reference is Abraham Wald’s WWII analysis of returning bombers. Armor where the surviving planes weren’t hit, because planes hit there didn’t come back. (https://en.wikipedia.org/wiki/Survivorship_bias)
- Goodhart’s law: “When a measure becomes a target, it ceases to be a good measure” (https://en.wikipedia.org/wiki/Goodhart%27s_law)
- MITRE’s own Center for Threat-Informed Defense wrote (September 2026) that two organizations can show the same technique as green on an ATT&CK heatmap while having dramatically different capabilities behind that box. (https://ctid.mitre.org/blog/2026/09/10/summiting-the-pyramid-2026/)